DefaultPlotStyle
- class Stoner.plot.formats.DefaultPlotStyle(*_, **kwargs)[source]
Bases:
MutableMappingProduces a default plot style.
To produce alternative plot styles, create subclasses of this plot. Either override or create additional attributes to define rc Parameters (see Matplotlib documentation for available rc parameters) and override the :py:meth:Stoner.pot.formats.DefaultPlotStyle.customise` method to carry out additional plot formatting.
- stylename
Name of the matplotlib style to use
- Type:
string
- Example
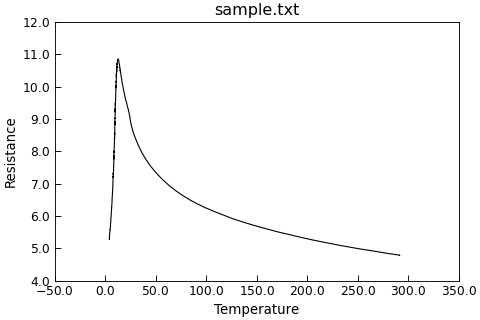
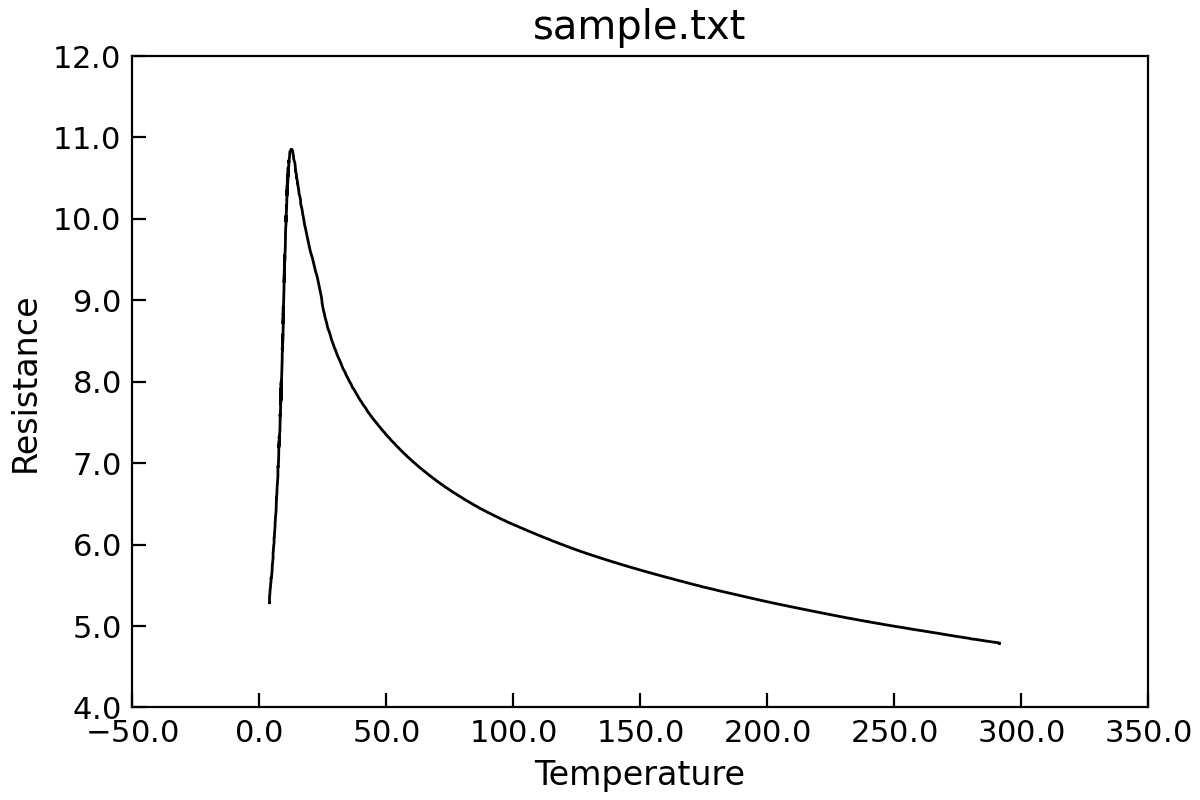
"""Example plot using default style."""

import os.path as path

from Stoner import Data, __home__
from Stoner.plot.formats import DefaultPlotStyle

filename = path.realpath(
    path.join(__home__, "..", "doc", "samples", "sample.txt")
)
d = Data(filename, setas="xy", template=DefaultPlotStyle)
d.plot()

Attributes Summary
Horribly hacky method to traverse over the class hierarchy for style sheet names.
Methods Summary
__call__(**kwargs)Call the template object can manipulate the rcParams that will be set.
annotate(ix, multiple, plot, **kwargs)Call all the routines necessary to annotate the axes etc.
apply()Update matplotlib rc parameters from any attributes starting template_.
clear()Reset everything back o defaults.
Implement hook to customise plot.
customise_axes(ax, _)Implement hook for for when we have an axis to manipulate.
get(k[,d])items()keys()new_figure([figure, projection, figsize, ...])Create a new figure.
pop(k[,d])If key is not found, d is returned if given, otherwise KeyError is raised.
popitem()as a 2-tuple; but raise KeyError if D is empty.
setdefault(k[,d])update([other])Update the template with new attributes from keyword arguments.
values()Attributes Documentation
- show_legend = True
- show_title = True
- show_xlabel = True
- show_ylabel = True
- show_zlabel = True
- stylename = 'default'
- stylesheet
Horribly hacky method to traverse over the class hierarchy for style sheet names.
- subplot_settings = {'panels': {'title': (True, False, False), 'xlabel': (False, False, True), 'ylabel': (True, True, True), 'zlabel': (False, False, False)}, 'subplots': {'title': (True, True, True), 'xlabel': (True, True, True), 'ylabel': (True, True, True), 'zlabel': (False, False, False)}, 'y2': {'title': (True, False, False), 'xlabel': (True, False, False), 'ylabel': (True, True, True), 'zlabel': (False, False, False)}}
Methods Documentation
- annotate(ix, multiple, plot, **kwargs)[source]
Call all the routines necessary to annotate the axes etc.
- Parameters:
ix (integer) – Index of current subplot
multiple (string) – how to handle multiple subplots
plot (Stoner.plot.PlotMixin) – The PlotMixin boject we’re working with
- customise()[source]
Implement hook to customise plot.
This method is supplied for sub classes to override to provide additional plot customisation after the rc parameters are updated from the class and instance attributes.
- customise_axes(ax, _)[source]
Implement hook for for when we have an axis to manipulate.
- Parameters:
ax (matplotlib axes) – The axes to be modified by this function.
Note
In the DefaultPlotStyle class this method is used to set SI units plotting mode for all axes.
- get(k[, d]) D[k] if k in D, else d. d defaults to None.
- items() a set-like object providing a view on D's items
- keys() a set-like object providing a view on D's keys
- new_figure(figure=False, projection='rectilinear', figsize=None, no_axes=False, ax=None, **kwargs)[source]
Create a new figure.
- Keyword Arguments:
projection (str) – Projection to use - default is rectilinear
figsize (2-tuple, None) – Figure size to use, default None is to use template setting
no_axes (bool) – Dop not create axes - default is False, ie. to create axes
ax (Axes, 3DAxes, None) – Axes/3DAxes to use, default is to create new axes.
**kwargs – Other keyword arguments passed to plt.figure()
This is called by PlotMixin to set up a new figure before we do anything.
- pop(k[, d]) v, remove specified key and return the corresponding value.
If key is not found, d is returned if given, otherwise KeyError is raised.
- popitem() (k, v), remove and return some (key, value) pair
as a 2-tuple; but raise KeyError if D is empty.
- setdefault(k[, d]) D.get(k,d), also set D[k]=d if k not in D
- update(other=(), /, **_)[source]
Update the template with new attributes from keyword arguments.
Up to one positional argument may be supplied
Keyword arguments may be supplied to set default parameters. Any Matplotlib rc parameter may be specified, with .’s replaced with _ and )_ replaced with __.
- values() an object providing a view on D's values
