simmons
- Stoner.analysis.fitting.models.tunnelling.simmons(V, A, phi, d)[source]
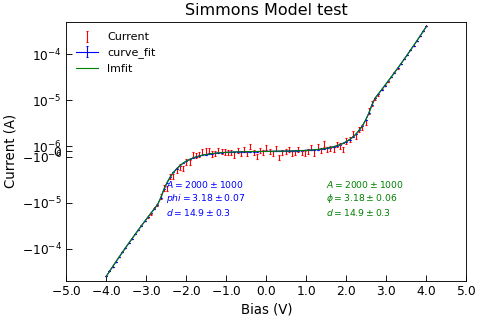
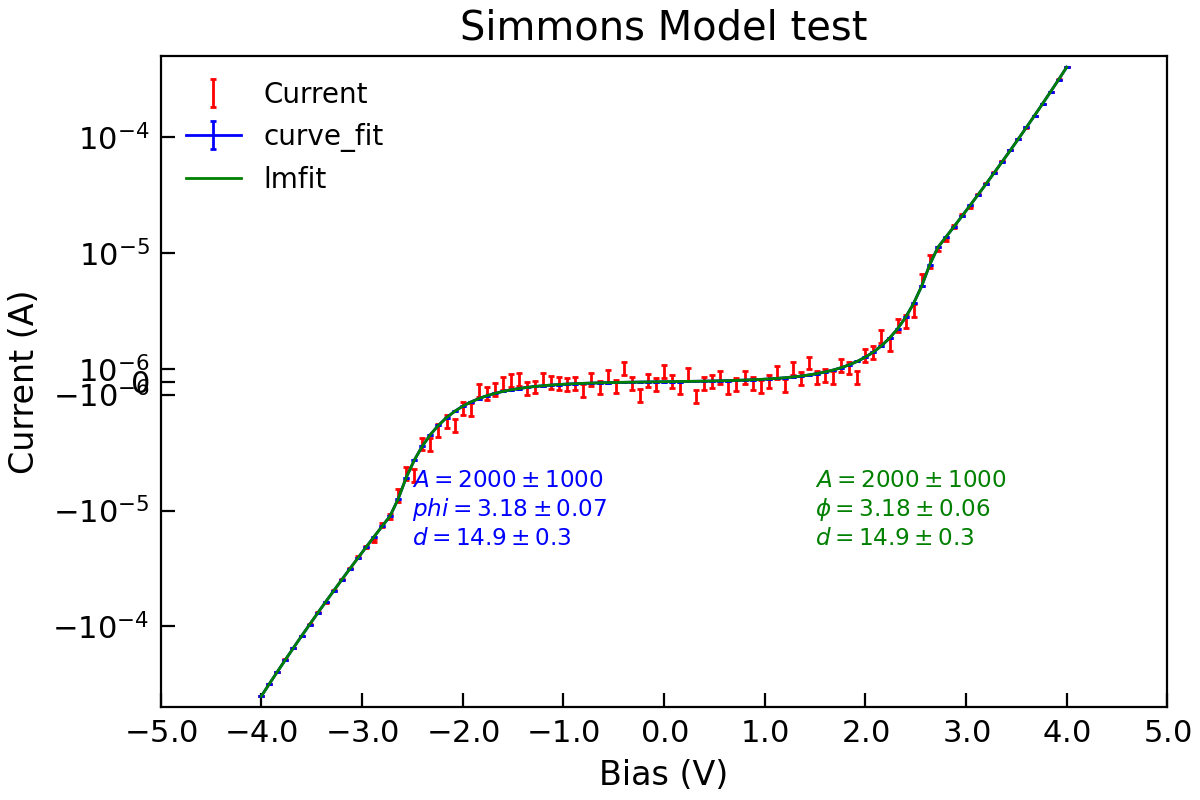
Simmons model of electron tunnelling.
- Parameters:
V (array) – Bias voltage
A (float) – Area of barrier in micron^2
phi (float) – barrier height in eV
d (float) – barrier width in angstroms
- Returns:
Data for tunneling rate according to the Sommons model.
Note
Simmons model from Simmons J. App. Phys. 34 6 1963
Example
"""Example of nDimArrhenius Fit."""

from numpy import linspace, ones_like
from numpy.random import normal

from Stoner import Data
from Stoner.analysis.fitting.models.tunnelling import Simmons, simmons

# Make some data
V = linspace(-4, 4, 101)
I = simmons(V, 2500, 3.2, 15.0) + normal(size=len(V), scale=5e-7)
dI = ones_like(V) * 500e-9

p0 = p0 = [2500, 3, 10.0]

d = Data(V, I, dI, setas="xye", column_headers=["Bias", "Current", "Noise"])

d.curve_fit(simmons, p0=p0, result=True, header="curve_fit", maxfev=2000)
d.setas = "xyey"
d.plot(fmt=["r,", "b-"], capsize=1)
d.annotate_fit(
    simmons,
    x=0.25,
    y=0.25,
    prefix="simmons",
    fontdict={"size": "x-small", "color": "blue"},
)

d.setas = "xye"
fit = Simmons()
d.lmfit(Simmons, p0=p0, result=True, header="lmfit", maxfev=2000)
d.setas = "x...y"
d.plot(fmt="g-", label="lmfit")
d.annotate_fit(
    fit,
    x=0.65,
    y=0.25,
    prefix="Simmons",
    fontdict={"size": "x-small", "color": "green"},
)

d.ylabel = "Current (A)"
d.xlabel = "Bias (V)"
d.title = "Simmons Model test"
d.yscale("symlog", linthresh=1e-5)
