lorentzian_diff
- Stoner.analysis.fitting.models.generic.lorentzian_diff(x, A, sigma, mu)[source]
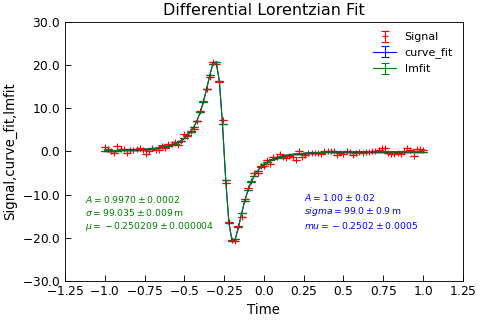
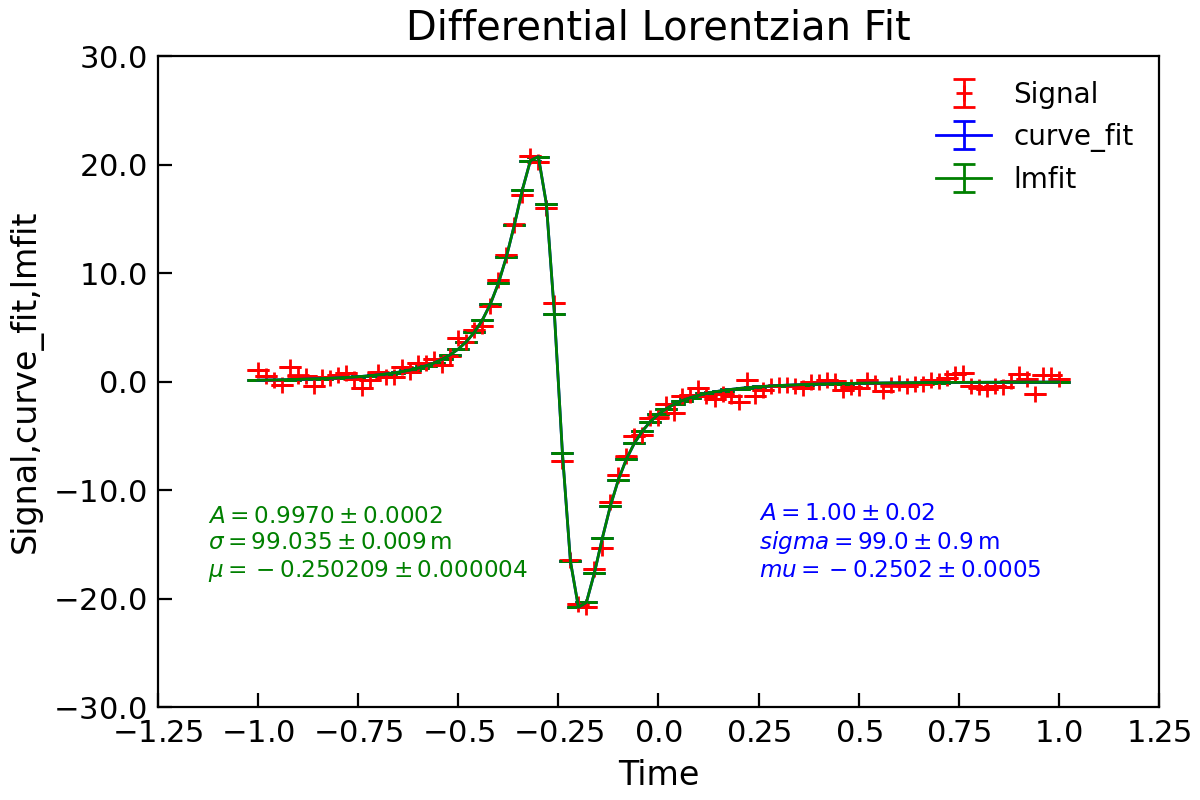
Implement a differential form of a Lorentzian peak.
- Parameters:
x (array) – x data
A (float) – Peak amplitude
sigma (float) – peak wideth
mu (float) – peak location in x
- Returns:
- math:`frac{A sigma left(2 mu - 2 xright)}{pi left(sigma^{2} +
left(- mu + xright)^{2}right)^{2}}`
Example
"""Test langevin fitting."""

from copy import copy

from numpy import linspace, ones_like
from numpy.random import normal

from Stoner import Data
from Stoner.analysis.fitting.models.generic import (
    Lorentzian_diff,
    lorentzian_diff,
)

x = linspace(-1.0, 1.0, 101)
params = [1, 0.1, -0.25]
y = lorentzian_diff(x, *params) + normal(size=len(x), scale=0.5)
dy = ones_like(x) * 5e-3
d = Data(x, y, dy, setas="xye", column_headers=["Time", "Signal", "dM"])

d.curve_fit(lorentzian_diff, p0=copy(params), result=True, header="curve_fit")

d.setas = "xye"

d.lmfit(Lorentzian_diff, result=True, header="lmfit", prefix="lmfit")


d.setas = "xyeyy"
d.plot(fmt=["r+", "b-", "g-"])

d.annotate_fit(
    lorentzian_diff,
    x=0.6,
    y=0.2,
    fontdict={"size": "x-small", "color": "blue"},
    mode="eng",
)
d.annotate_fit(
    Lorentzian_diff,
    x=0.05,
    y=0.2,
    fontdict={"size": "x-small", "color": "green"},
    prefix="lmfit",
    mode="eng",
)
d.title = "Differential Lorentzian Fit"

