AnalysisMixin
- class Stoner.Analysis.AnalysisMixin[source]
Bases:
objectA mixin calss designed to work with
Stoner.Core.DataFileto provide additional analysis methods.Methods Summary
apply(func[, col, replace, header])Apply the given function to each row in the data set and adds to the data set.
clip(clipper[, column])Clips the data based on the column and the clipper value.
decompose([xcol, ycol, sym, asym, replace])Given (x,y) data, decomposes the y part into symmetric and antisymmetric contributions in x.
integrate([xcol, ycol, result, header, ...])Integrate a column of data, optionally returning the cumulative integral.
normalise([target, base, replace, header, ...])Normalise data columns by dividing through by a base column value.
stitch(other[, xcol, ycol, overlap, ...])Apply a scaling to this data set to make it stich to another dataset.
threshold(threshold, **kargs)Find partial indices where the data in column passes the threshold, rising or falling.
Methods Documentation
- apply(func, col=None, replace=True, header=None, **kargs)[source]
Apply the given function to each row in the data set and adds to the data set.
- Parameters:
func (callable) – The function to apply to each row of the data.
col (index) – The column in which to place the result of the function
- Keyword Arguments:
Note
If any extra keyword arguments are supplied then these are passed to the function directly. If you need to pass any arguments that overlap with the keyword arguments to :py:math:`AnalysisMixin.apply` then these can be supplied in a dictionary argument _extra.
The callable func should have a signature:
def func(row,**kargs):
and should return either a single float, in which case it will be used to repalce the specified column, or an array, in which case it is used to completely replace the row of data.
If the function returns a complete row of data, then the replace parameter will cause the return value to be a new datafile, leaving the original unchanged. The headers parameter can give the complete column headers for the new data file.
- Returns:
(
Stoner.Data) – The newly modified Data object.
- clip(clipper, column=None)[source]
Clips the data based on the column and the clipper value.
- Parameters:
column (index) – Column to look for the maximum in
clipper (tuple or array) – Either a tuple of (min,max) or a numpy.ndarray - in which case the max and min values in that array will be used as the clip limits
- Returns:
(
Stoner.Data) – The newly modified Data object.
Note
If column is not defined (or is None) the
DataFile.setascolumn assignments are used.
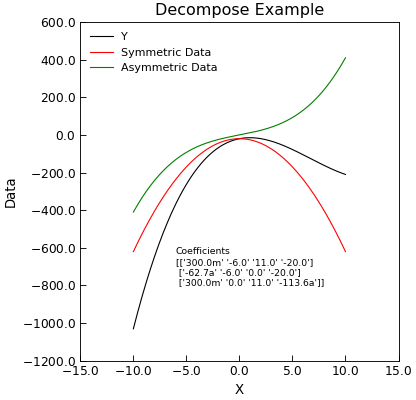
- decompose(xcol=None, ycol=None, sym=None, asym=None, replace=True, **kwords)[source]
Given (x,y) data, decomposes the y part into symmetric and antisymmetric contributions in x.
- Keyword Arguments:
xcol (index) – Index of column with x data - defaults to first x column in self.setas
ycol (index or list of indices) – indices of y column(s) data
sym (index) – Index of column to place symmetric data in default, append to end of data
asym (index) – Index of column for asymmetric part of ata. Defaults to appending to end of data
replace (bool) – Overwrite data with output (true)
- Returns:
self – The newly modified
AnalysisMixin.
Example
"""Decompose Into symmetric and antisymmetric parts example."""
from numpy import linspace, reshape, array

from Stoner import Data
from Stoner.tools import format_val

x = linspace(-10, 10, 201)
y = 0.3 * x**3 - 6 * x**2 + 11 * x - 20
d = Data(x, y, setas="xy", column_headers=["X", "Y"])
d.decompose()
d.setas = "xyyy"
coeffs = d.polyfit(polynomial_order=3)
str_coeffs = [format_val(c, mode="eng", places=1) for c in coeffs.ravel()]
str_coeffs = reshape(array(str_coeffs), coeffs.shape)
d.plot()
d.text(
    -6,
    -800,
    "Coefficients\n{}".format(str_coeffs),
    fontdict={"size": "x-small"},
)
d.ylabel = "Data"
d.title = "Decompose Example"
- integrate(xcol=None, ycol=None, result=None, header=None, result_name=None, output='data', bounds=<function AnalysisMixin.<lambda>>, **kargs)[source]
Integrate a column of data, optionally returning the cumulative integral.
- Parameters:
xcol (index) – The X data column index (or header)
ycol (index)
The Y data column index (or header)
- Keyword Arguments:
result (index or None) – Either a column index (or header) to overwrite with the cumulative data, or True to add a new column or None to not store the cumulative result.
result_name (str) – The metadata name for the final result
header (str) – The name of the header for the results column.
output (Str) – What to return - ‘data’ (default) - this object, ‘result’: final result
bounds (callable) – A function that evaluates for each row to determine if the data should be integrated over.
**kargs – Other keyword arguments are fed direct to the scipy.integrate.cumtrapz method
- Returns:
(
Stoner.Data) – The newly modified Data object.
Note
This is a pass through to the scipy.integrate.cumtrapz routine which just uses trapezoidal integration. A better alternative would be to offer a variety of methods including simpson’s rule and interpolation of data. If xcol or ycol are not specified then the current values from the
Stoner.Core.DataFile.setasattribute are used.
- normalise(target=None, base=None, replace=True, header=None, scale=None, limits=(0.0, 1.0))[source]
Normalise data columns by dividing through by a base column value.
- Parameters:
target (index) – One or more target columns to normalise can be a string, integer or list of strings or integers. If None then the default ‘y’ column is used.
- Keyword Arguments:
base (index) – The column to normalise to, can be an integer or string. Deprecated can also be a tuple (low, high) being the output range
replace (bool) – Set True(default) to overwrite the target data columns
header (string or None) – The new column header - default is target name(norm)
scale (None or tuple of float,float) – Output range after normalising - low,high or None to map to -1,1
limits (float,float) – (low,high) - Take the input range from the high and low fraction of the input when sorted.
- Returns:
(
Stoner.Data) – The newly modified Data object.
Notes
The limits parameter is used to set the input scale being normalised from - if the data has a few outliers then this setting can be used to clip the input range before normalising. The parameters in the limit are the values at the low and high fractions of the cumulative distribution function of the data.
- stitch(other, xcol=None, ycol=None, overlap=None, min_overlap=0.0, mode='All', func=None, p0=None)[source]
Apply a scaling to this data set to make it stich to another dataset.
- Parameters:
other (DataFile) – Another data set that is used as the base to stitch this one on to
xcol,ycol (index or None) – The x and y data columns. If left as None then the current setas attribute is used.
- Keyword Arguments:
overlap (tuple of (lower,higher) or None) – The band of x values that are used in both data sets to match, if left as None, thenthe common overlap of the x data is used.
min_overlap (float) – If you know that overlap must be bigger than a certain amount, the bounds between the two data sets needs to be adjusted. In this case min_overlap shifts the boundary of the overlap on this DataFile.
mode (str) – Unless func is specified, controls which parameters are actually variable, defaults to all of them.
func (callable) – a stitching function that transforms \((x,y)\rightarrow(x',y')\). Default is to use functions defined by mode
p0 (iterable) – if func is not None then p0 should be the starting values for the stitching function parameters
- Returns:
(
Stoner.Data) – A copy of the currentAnalysisMixinwith the x and y data columns adjusted to stitch
To stitch the data together, the x and y data in the current data file is transforms so that \(x'=x+A\) and \(y'=By+C\) where \(A,B,C\) are constants and \((x',y')\) are close matches to the \((x,y)\) data in other. The algorithm assumes that the overlap region contains equal numbers of \((x,y)\) points mode controls whether A,B, and C are fixed or adjustable
“All” - all three parameters adjustable
“Scale y, shift x” - C is fixed at 0.0
“Scale and shift y” A is fixed at 0.0
“Scale y” - only B is adjustable
“Shift y” - Only c is adjsutable
“Shift x” - Only A is adjustable
“Shift both” - B is fixed at 1.0
See also
User Guide section Stitching Datasets together
Example
- threshold(threshold, **kargs)[source]
Find partial indices where the data in column passes the threshold, rising or falling.
- Parameters:
threshold (float) – Value to look for in column col
- Keyword Arguments:
col (index) – Column index to look for data in
rising (bool) – look for case where the data is increasing in value (default True)
falling (bool) – look for case where data is fallinh in value (default False)
xcol (index, bool or None) – rather than returning a fractional row index, return the interpolated value in column xcol. If xcol is False, then return a complete row all_vals (bool): return all crossing points of the threshold or just the first. (default False)
transpose (bbool) – Swap the x and y columns around - this is most useful when the column assignments have been done via the setas attribute
all_vals (bool) – Return all values that match the criteria, or just the first in the file.
- Returns:
(float) – Either a sing;le fractional row index, or an in terpolated x value
Note
If you don’t specify a col value or set it to None, then the assigned columns via the
DataFile.setasattribute will be used.Warning
There has been an API change. Versions prior to 0.1.9 placed the column before the threshold in the positional argument list. In order to support the use of assigned columns, this has been swapped to the present order.
