PlotMixin
- class Stoner.plot.PlotMixin(*args, **kwargs)[source]
Bases:
objectA mixin class that works with
Stoner.Core.DataFileto add additional plotting functionality.- Parameters:
args (tuple) – Arguments to pass to
Stoner.Core.DataFile.__init__()kwargs (dict) – keyword arguments to pass to b DataFile.__init__
- ax
The current axes on the current figure.
- Type:
matplotlib.Axes
- fig
The current figure object being worked with
- Type:
matplotlib.figure
- showfig
Controls whether plot functions return a copy of the figure (True), the DataFile (False) or Nothing (None)
- Type:
bool or None
- subplots
essentially the same as
PlotMixin.axesbut ensures that the list of subplots is synchronised to the number fo Axes.- Type:
list of matplotlib.Axes
- template
A plot style template subclass or object that determines the format and appearance of plots.
- Type:
Sonter.plot.formats.DefaultPlotStyleor instance
Attributes Summary
Return the current axis number.
Return the current axes object.
Get the current cmap.
Get the current figure.
Return the current figure number.
Return the labels for the plot columns.
Return either the current figure or self or None.
Return the subplot instances.
Return the current plot template.
Methods Summary
colormap_xyz([xcol, ycol, zcol])Make a xyz plot that forces the use of plt.colormap.
contour_xyz([xcol, ycol, zcol, shape, xlim, ...])Make a xyz plot that forces the use of plt.contour.
figure([figure, projection])Set the figure used by
Stoner.plot.PlotMixin.griddata([xcol, ycol, zcol, ucol, shape, ...])Convert xyz data onto a regular grid.
image_plot([xcol, ycol, zcol, shape, xlim, ylim])Grid up the three columns of data and plot.
inset([parent, loc, width, height])Add a new set of axes as an inset to the current plot.
legend(*args, **kwargs)Pass Through to stop attribute access over-riding a handy method.
plot(*args, **kwargs)Try to make an appropriate plot based on the defined column assignments.
plot_matrix([xvals, yvals, rectang, cmap, ...])Plot a surface plot by assuming that the current dataset represents a regular matrix of points.
plot_voxels([xcol, ycol, zcol, ucol, cmap])Make a volumetric plot of data arranged as x,y,z,u.
plot_xy([xcol, ycol, fmt, xerr, yerr])Makesa simple X-Y plot of the specified data.
plot_xyuv([xcol, ycol, ucol, vcol, wcol])Make an overlaid image and quiver plot.
plot_xyuvw([xcol, ycol, ucol, vcol, wcol])Make an overlaid image and quiver plot.
plot_xyz([xcol, ycol, zcol, shape, xlim, ...])Plot a surface plot based on rows of X,Y,Z data using matplotlib.pcolor().
plot_xyzuvw([xcol, ycol, zcol, ucol, vcol, wcol])Plot a vector field plot based on rows of X,Y,Z (U,V,W) data using ,ayavi.
quiver_plot([xcol, ycol, ucol, vcol])Make a 2D Quiver plot from the data.
subplot(*args, **kwargs)Pass throuygh for
matplotlib.pyplot.subplot().subplot2grid(*args, **kwargs)Provide a pass through to
matplotlib.pyplot.subplot2grid().x2()Generate a new set of axes with a second x-scale.
y2()Generate a new set of axes with a second y-scale.
Attributes Documentation
- ax
Return the current axis number.
- axes
Return the current axes object.
- cmap
Get the current cmap.
- fig
Get the current figure.
- fignum
Return the current figure number.
- labels
Return the labels for the plot columns.
- multiple = 'common'
- no_fmt = [<function errorfill>]
- positional_fmt = [<function plot>, <function semilogx>, <function semilogy>, <function loglog>]
- showfig
Return either the current figure or self or None.
The return value depends on whether the attribute is True or False or None.
- subplots
Return the subplot instances.
- template
Return the current plot template.
Methods Documentation
- colormap_xyz(xcol=None, ycol=None, zcol=None, **kwargs)
Make a xyz plot that forces the use of plt.colormap.
- Parameters:
xcol (index) – Xcolumn index or label
ycol (index) – Y column index or label
zcol (index) – Z column index or label
- Keyword Arguments:
shape (two-tuple) – Number of points along x and y in the grid - defaults to a square of sidelength = square root of the length of the data.
xlim (tuple) – The xlimits, defaults to automatically determined from data
ylim (tuple) – The ylimits, defaults to automatically determined from data
plotter (function) – Function to use to plot data. Defaults to plt.contour
colorbar (bool) – Draw the z-scale color bar beside the plot (True by default)
show_plot (bool) – Turn on interfactive plotting and show plot when drawn
save_filename (string or None) – If set to a string, save the plot with this filename
figure (integer or matplotlib.figure or boolean) – Controls which figure is used for the plot, or if a new figure is opened.
**kwargs (dict) – Other arguments are passed on to the plotter.
- Returns:
A matplotlib figure
- contour_xyz(xcol=None, ycol=None, zcol=None, shape=None, xlim=None, ylim=None, plotter=None, **kwargs)
Make a xyz plot that forces the use of plt.contour.
- Args:
- xcol (index):
Xcolumn index or label
- ycol (index):
Y column index or label
- zcol (index):
Z column index or label
- Keyword Arguments:
shape (two-tuple) – Number of points along x and y in the grid - defaults to a square of sidelength = square root of the length of the data.
xlim (tuple) – The xlimits, defaults to automatically determined from data
ylim (tuple) – The ylimits, defaults to automatically determined from data
plotter (function) – Function to use to plot data. Defaults to plt.contour
show_plot (bool) – Turn on interfactive plotting and show plot when drawn
save_filename (string or None) – If set to a string, save the plot with this filename
figure (integer or matplotlib.figure or boolean) – Controls which figure is used for the plot, or if a new figure is opened.
**kwargs (dict) – Other arguments are passed on to the plotter.
- Returns:
A matplotlib figure
- figure(figure=None, projection='rectilinear', **kwargs)
Set the figure used by
Stoner.plot.PlotMixin.- Parameters:
figure (matplotlib.Figure or int) – Figure to switch to
- Returns:
The current Stoner.plot.PlotMixin instance
- griddata(xcol=None, ycol=None, zcol=None, ucol=None, shape=None, xlim=None, ylim=None, zlim=None, method='linear', **kwargs)
Convert xyz data onto a regular grid.
- Parameters:
xcol (index) – Xcolumn index or label
ycol (index) – Y column index or label
zcol (index) – Z column index or label
- Keyword Arguments:
ucol (index) – U (magnitude) column index or label
shape (two-tuple, three-ruple) – Number of points along x and y in the grid - defaults to a square of sidelength = square root of the length of the data.
xlim (tuple) – The xlimits
ylim (tuple) – The ylimits
zlim (tuple) – The ylimits
method (string) – Type of interpolation to use, default is linear
ReturnsL –
- (X,Y,Z) or (X,Y,Z,M):
three two dimensional arrays of the coordinates of the interpolated data or 4 three diemensional arrays of the interpolated data
Notes
Depending on whether 3 or 4 columns of data can be identified, this method will produce data for a \(Z(X,Y)\) plot or a \(M(X,Y,Z)\) volumetric plot.
- image_plot(xcol=None, ycol=None, zcol=None, shape=None, xlim=None, ylim=None, **kwargs)
Grid up the three columns of data and plot.
- Parameters:
xcol (index) – Xcolumn index or label
ycol (index) – Y column index or label
zcol (index) – Z column index or label
- Keyword Arguments:
shape (two-tuple) – Number of points along x and y in the grid - defaults to a square of sidelength = square root of the length of the data.
xlim (tuple) – The xlimits, defaults to automatically determined from data
ylim (tuple) – The ylimits, defaults to automatically determined from data
xlabel (string) – X axes label. Default is None - guess from xvals or metadata
ylabel (string) – Y axes label, Default is None - guess from metadata
zlabel (string) – Z axis label, Default is None - guess from metadata
plotter (function) – Function to use to plot data. Defaults to plt.contour
show_plot (bool) – Turn on interfactive plotting and show plot when drawn
save_filename (string or None) – If set to a string, save the plot with this filename
figure (integer or matplotlib.figure or boolean) – Controls which figure is used for the plot, or if a new figure is opened.
**kwargs (dict) – Other arguments are passed on to the plotter.
- Returns:
A matplotlib figure
- inset(parent=None, loc=None, width=0.35, height=0.3, **kwargs)
Add a new set of axes as an inset to the current plot.
- Keyword Arguments:
parent (matplotlib axes) – Which set of axes to add inset to, defaults to the current set
loc (int or string) – Inset location - can be a string like top right or upper right or a number.
width,height (int,float or string) – the dimensions of the inset specified as a integer %, or floating point fraction of the parent axes, or as a string measurement.
kwargs (dictionary) – all other keywords are passed through to inset_locator.inset_axes
- Returns:
A new set of axes
- legend(*args, **kwargs)
Pass Through to stop attribute access over-riding a handy method.
- plot(*args, **kwargs)
Try to make an appropriate plot based on the defined column assignments.
The column assignments are examined to determine whether to plot and x,y plot or an x,y,z plot and whether to plot error bars (for an x,y plot). All keyword argume nts are passed through to the selected plotting routine.
- plot_matrix(xvals=None, yvals=None, rectang=None, cmap=<matplotlib.colors.ListedColormap object>, show_plot=True, title='', **kwords)
Plot a surface plot by assuming that the current dataset represents a regular matrix of points.
- Parameters:
xvals (index, list or numpy.array) – Either a column index or name or a list or numpytarray of column values. The default (None) uses the first column of data
yvals (int or list) – Either a row index or a list or numpy array of row values. The default (None) uses the column_ headings interpreted as floats
rectang (tuple) – a tuple of either 2 or 4 elements representing either the origin (row,column) or size (origin, number of rows, number of columns) of data to be used for the z0data matrix
- Keyword Arguments:
cmap (matplotlib colour map) – Surface colour map - defaults to the jet colour map
show_plot (bool) – True Turns on interactive plot control
title (string) – Optional parameter that specifies the plot title - otherwise the current DataFile filename is used
xlabel (string) – X axes label. Default is None - guess from xvals or metadata
ylabel (string) – Y axes label, Default is None - guess from metadata
zlabel (string) – Z axis label, Default is None - guess from metadata
figure (matplotlib figure) – Controls what matplotlib figure to use. Can be an integer, or a matplotlib.figure or False. If False then a new figure is always used, otherwise it will default to using the last figure used by this DataFile object.
plotter (callable) – Optional argument that passes a plotting function into the routine. Sensible choices might be plt.plot (default), py.semilogy, plt.semilogx
kwords (dict) – A dictionary of other keyword arguments to pass into the plot function.
Returns – The matplotib figure with the data plotted
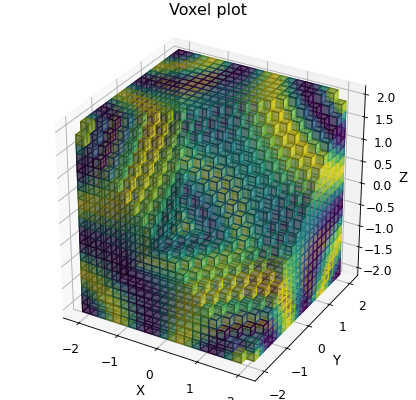
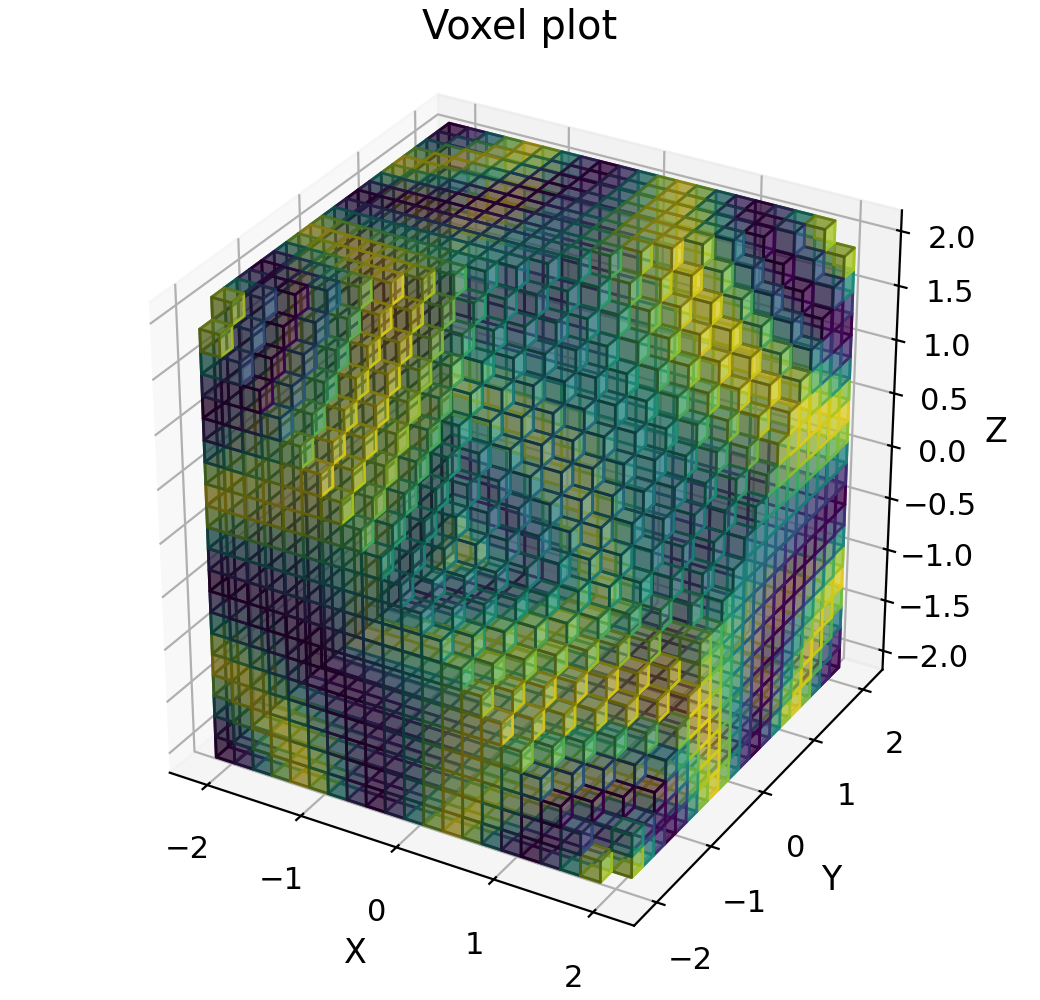
- plot_voxels(xcol=None, ycol=None, zcol=None, ucol=None, cmap=None, **kwargs)
Make a volumetric plot of data arranged as x,y,z,u.
- Parameters:
xcol (index) – Xcolumn index or label
ycol (index) – Y column index or label
zcol (index) – Z column index or label
ucol (index) – U column index or label
- Keyword Arguments:
visible (callable) – A function f(x,y,z) that returns True if a voxcel is to be visible
cmap (colourmap) – A Matplotlib colour map to apply for the magnitude (u column) data.
- Returns:
(matplotlib.Figure) – The figure window contacting the plot
Example
"""3D surface plot example."""

import matplotlib.cm
import numpy as np

from Stoner import Data

x, y, z = np.meshgrid(
    np.linspace(-2, 2, 21), np.linspace(-2, 2, 21), np.linspace(-2, 2, 21)
)
x = x.ravel()
y = y.ravel()
z = z.ravel()
u = np.sin(x * y * z)

p = Data(x, y, z, u, setas="xyzu", column_headers=["X", "Y", "Z"])

p.plot_voxels(cmap=matplotlib.cm.jet, visible=lambda x, y, z: x - y + z < 2.0)
p.set_box_aspect((1, 1, 1.0))  # Passing through to the current axes
p.title = "Voxel plot"
- plot_xy(xcol=None, ycol=None, fmt=None, xerr=None, yerr=None, **kwargs)
Makesa simple X-Y plot of the specified data.
- Parameters:
xcol (index) – Xcolumn index or label
ycol (index) – Y column index or label
- Keyword Arguments:
fmt (strong or sequence of strings) – Specifies the format for the plot - see matplotlib documentation for details
xerr,yerr (index) – C
plt.errorbar (olumns of data to get x and y errorbars from. Setting these turns the default plotter to)
xlabel (string) – X axes label. Default is None - guess from xvals or metadata
ylabel (string) – Y axes label, Default is None - guess from metadata
title (string) – Optional parameter that specifies the plot title - otherwise the current DataFile filename is used
plotter (function) – Function to use to plot data. Defaults to plt.plot unless error bars are set
show_plot (bool) – Turn on interfactive plotting and show plot when drawn
save_filename (string or None) – If set to a string, save the plot with this filename
figure (integer or matplotlib.figure or boolean) – Controls which figure is used for the plot, or if a new figure is opened.
multiple (string) –
- how to handle multiple y-axes with a common x axis. Options are:
common single y-axis (default)
panels panels sharing common x axis
sub plots sub plots
y2 single axes with 2 y scales
**kwargs (dict) – Other arguments are passed on to the plotter.
- Returns:
A matplotlib.figure instance
- plot_xyuv(xcol=None, ycol=None, ucol=None, vcol=None, wcol=None, **kwargs)
Make an overlaid image and quiver plot.
Args:
- !c xcol (index):
Xcolumn index or label
- ycol (index):
Y column index or label
- zcol (index):
Z column index or label
- ucol (index):
U column index or label
- vcol (index):
V column index or label
- wcol (index):
W column index or label
- Keyword Arguments:
- show_plot (bool):
True Turns on interactive plot control
- title (string):
Optional parameter that specifies the plot title - otherwise the current DataFile filename is used
- save_filename (string):
Filename used to save the plot
- figure (matplotlib figure):
Controls what matplotlib figure to use. Can be an integer, or a matplotlib.figure or False. If False then a new figure is always used, otherwise it will default to using the last figure used by this DataFile object.
- no_quiver (bool):
Do not overlay quiver plot (in cases of dense meshes of points)
- plotter (callable):
Optional argument that passes a plotting function into the routine. Default is a 3d surface plotter, but contour plot and pcolormesh also work.
- **kwargs (dict):
A dictionary of other keyword arguments to pass into the plot function.
- plot_xyuvw(xcol=None, ycol=None, ucol=None, vcol=None, wcol=None, **kwargs)
Make an overlaid image and quiver plot.
Args:
- !c xcol (index):
Xcolumn index or label
- ycol (index):
Y column index or label
- zcol (index):
Z column index or label
- ucol (index):
U column index or label
- vcol (index):
V column index or label
- wcol (index):
W column index or label
- Keyword Arguments:
- show_plot (bool):
True Turns on interactive plot control
- title (string):
Optional parameter that specifies the plot title - otherwise the current DataFile filename is used
- save_filename (string):
Filename used to save the plot
- figure (matplotlib figure):
Controls what matplotlib figure to use. Can be an integer, or a matplotlib.figure or False. If False then a new figure is always used, otherwise it will default to using the last figure used by this DataFile object.
- no_quiver (bool):
Do not overlay quiver plot (in cases of dense meshes of points)
- plotter (callable):
Optional argument that passes a plotting function into the routine. Default is a 3d surface plotter, but contour plot and pcolormesh also work.
- **kwargs (dict):
A dictionary of other keyword arguments to pass into the plot function.
- plot_xyz(xcol=None, ycol=None, zcol=None, shape=None, xlim=None, ylim=None, projection='3d', **kwargs)
Plot a surface plot based on rows of X,Y,Z data using matplotlib.pcolor().
- Parameters:
xcol (index) – Xcolumn index or label
ycol (index) – Y column index or label
zcol (index) – Z column index or label
- Keyword Arguments:
shape (tuple) – Defines the shape of the surface (i.e. the number of X and Y value. If not provided or None, then the routine will attempt to calculate these from the data provided
xlim (tuple) – Defines the x-axis limits and grid of the data to be plotted
ylim (tuple) – Defines the Y-axis limits and grid of the data data to be plotted
cmap (matplotlib colour map) – Surface colour map - defaults to the jet colour map
show_plot (bool) – True Turns on interactive plot control
title (string) – Optional parameter that specifies the plot title - otherwise the current DataFile filename is used
save_filename (string) – Filename used to save the plot
figure (matplotlib figure) – Controls what matplotlib figure to use. Can be an integer, or a matplotlib.figure or False. If False then a new figure is always used, otherwise it will default to using the last figure used by this DataFile object.
plotter (callable) – Optional argument that passes a plotting function into the routine. Default is a 3d surface plotter, but contour plot and pcolormesh also work.
projection (string or None) – Whether to use a 3D projection or regular 2D axes (default is 3D)
**kwargs (dict) – A dictionary of other keyword arguments to pass into the plot function.
- Returns:
A matplotlib.figure instance
- plot_xyzuvw(xcol=None, ycol=None, zcol=None, ucol=None, vcol=None, wcol=None, **kwargs)
Plot a vector field plot based on rows of X,Y,Z (U,V,W) data using ,ayavi.
- Parameters:
xcol (index) – Xcolumn index or label
ycol (index) – Y column index or label
zcol (index) – Z column index or label
ucol (index) – U column index or label
vcol (index) – V column i ndex or label
wcol (index) – W column index or label
- Keyword Arguments:
colormap (string) – Vector field colour map - defaults to the jet colour map
colors (column index or numpy array) – Values used to map the colors of the resultant file.
mode (string) – glyph type, default is “cone”
scale_factor (float) – Scale-size of glyphs.
figure (mlab figure) – Controls what mlab figure to use. Can be an integer, or a mlab.figure or False. If False then a new figure is always used, otherwise it will default to using the last figure used by this DataFile object.
plotter (callable) – Optional argument that passes a plotting function into the routine. Sensible choices might be plt.plot (default), py.semilogy, plt.semilogx
kwargs (dict) – A dictionary of other keyword arguments to pass into the plot function.
- Returns:
A mayavi scene instance
- quiver_plot(xcol=None, ycol=None, ucol=None, vcol=None, **kwargs)
Make a 2D Quiver plot from the data.
- Parameters:
xcol (index) – Xcolumn index or label
ycol (index) – Y column index or label
zcol (index) – Z column index or label
ucol (index) – U column index or label
vcol (index) – V column i ndex or label
wcol (index) – W column index or label
- Keyword Arguments:
xlabel (string) – X axes label. Default is None - guess from xvals or metadata
ylabel (string) – Y axes label, Default is None - guess from metadata
zlabel (string) – Z axis label, Default is None - guess from metadata
plotter (function) – Function to use to plot data. Defaults to plt.contour
headlength,headwidth,headaxislength (float) – Controls the size of the quiver heads
show_plot (bool) – Turn on interfactive plotting and show plot when drawn
save_filename (string or None) – If set to a string, save the plot with this filename
figure (integer or matplotlib.figure or boolean) – Controls which figure is used for the plot, or if a new figure is opened.
**kwargs (dict) – Other arguments are passed on to the plotter.
- Returns:
A matplotlib figure instance.
Keyword arguments are all passed through to
matplotlib.plt.quiver().
- subplot(*args, **kwargs)
Pass throuygh for
matplotlib.pyplot.subplot().- Parameters:
rows (int) – If this is the only argument, then a three digit number representing the rows,columns,index arguments. If separate rows, column and index are provided, then this is the number of rows of sub-plots in one figure.
columns (int) – The number of columns of sub-plots in one figure.
index (int) – Index (1 based) of the current sub-plot.
- Returns:
A matplotlib.Axes instance representing the current sub-plot
As well as passing through to the plyplot routine of the same name, this function maintains a list of the current sub-plot axes via the subplots attribute.
- subplot2grid(*args, **kwargs)
Provide a pass through to
matplotlib.pyplot.subplot2grid().
- x2()
Generate a new set of axes with a second x-scale.
- Returns:
The new matplotlib.axes instance.
- y2()
Generate a new set of axes with a second y-scale.
- Returns:
The new matplotlib.axes instance
