Data.plot_voxels
- Data.plot_voxels(xcol=None, ycol=None, zcol=None, ucol=None, cmap=None, **kwargs)
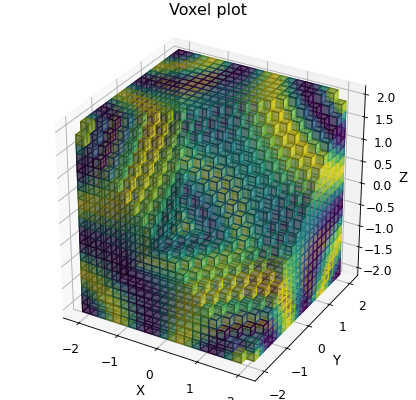
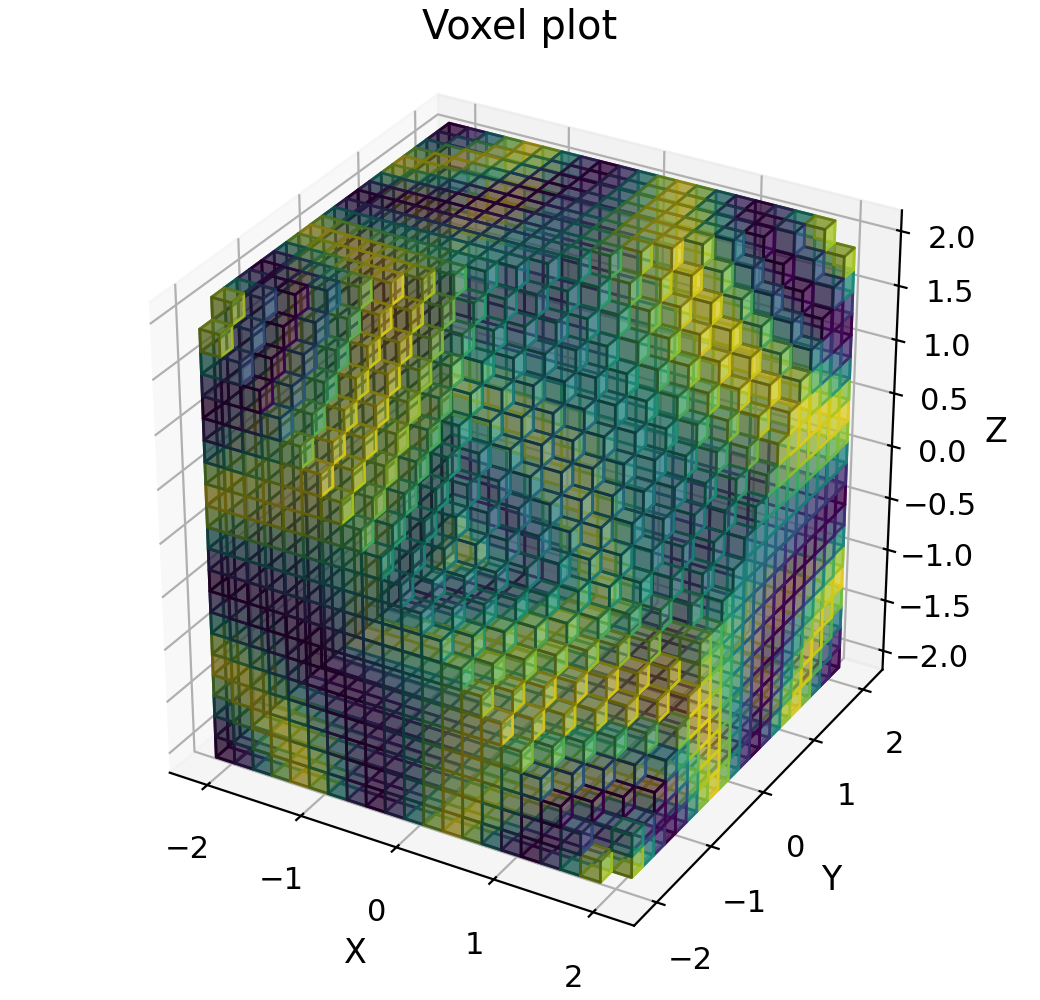
Make a volumetric plot of data arranged as x,y,z,u.
- Parameters:
xcol (index) – Xcolumn index or label
ycol (index) – Y column index or label
zcol (index) – Z column index or label
ucol (index) – U column index or label
- Keyword Arguments:
visible (callable) – A function f(x,y,z) that returns True if a voxcel is to be visible
cmap (colourmap) – A Matplotlib colour map to apply for the magnitude (u column) data.
- Returns:
(matplotlib.Figure) – The figure window contacting the plot
Example
"""3D surface plot example."""

import matplotlib.cm
import numpy as np

from Stoner import Data

x, y, z = np.meshgrid(
    np.linspace(-2, 2, 21), np.linspace(-2, 2, 21), np.linspace(-2, 2, 21)
)
x = x.ravel()
y = y.ravel()
z = z.ravel()
u = np.sin(x * y * z)

p = Data(x, y, z, u, setas="xyzu", column_headers=["X", "Y", "Z"])

p.plot_voxels(cmap=matplotlib.cm.jet, visible=lambda x, y, z: x - y + z < 2.0)
p.set_box_aspect((1, 1, 1.0))  # Passing through to the current axes
p.title = "Voxel plot"
