Data.outlier_detection
- Data.outlier_detection(column=None, window=7, shape='boxcar', certainty=3.0, action='mask', width=1, func=None, **kwargs)
Detect outliers in a column of data.
- Parameters:
datafile (Data) – Data object to work with if not being used as a bound method.
column (column index) – specifying column for outlier detection. If not set, defaults to the current y set column.
- Keyword Arguments:
window (int) – data window for anomaly detection
shape (str) – The name of a
scipy.signalwindowing function to use when averaging the data. Defaults to ‘boxcar’ for a flat average.certainty (float) – eg 3 detects data 3 standard deviations from average
action (str or callable) – what to do with outlying points, options are * ‘mask’ outlier points are masked (default) * ‘mask row’ outlier rows are masked * ‘delete’ outlier rows are deleted * callable the value of the action keyword is called with the outlier row * anything else defaults to do nothing.
width (odd integer) – Number of rows that an outliing spike could occupy. Defaults to 1.
func (callable) – A function that determines if the current row is an outlier.
action_args (tuple) – if action is callable, then action_args can be used to pass extra arguments to the action callable
action_kwargs (dict) – If action is callable, then action_kwargs can be used to pass extra keyword arguments to the action callable.
**kwargs – Keywords used to determine column assignments.
- Returns:
(
Stoner.Data) – The newly modified Data object.
outlier_detection will add row numbers of detected outliers to the metadata of d, also will perform action depending on request eg ‘mask’, ‘delete’ (any other action defaults to doing nothing).
The detection looks at a window of the data, takes the average and looks to see if the current data point falls certainty * std deviations away from data average.
The outlier detection function has the signatrure:
def outlier(row,column,window,certainty,**kwargs)
    #code
    return True # or False
All extra keyword arguments are passed to the outlier detector.
IF action is a callable function then it should take the form of:
def action(i,column, data, *action_args, **action_kwargs):
    pass
where i is the number of the outlier row, column the same value as above and data is the complete set of data.
In all cases the indices of the outlier rows are added to the ;outlier’ metadata.
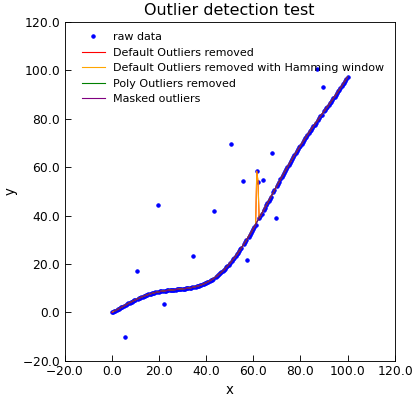
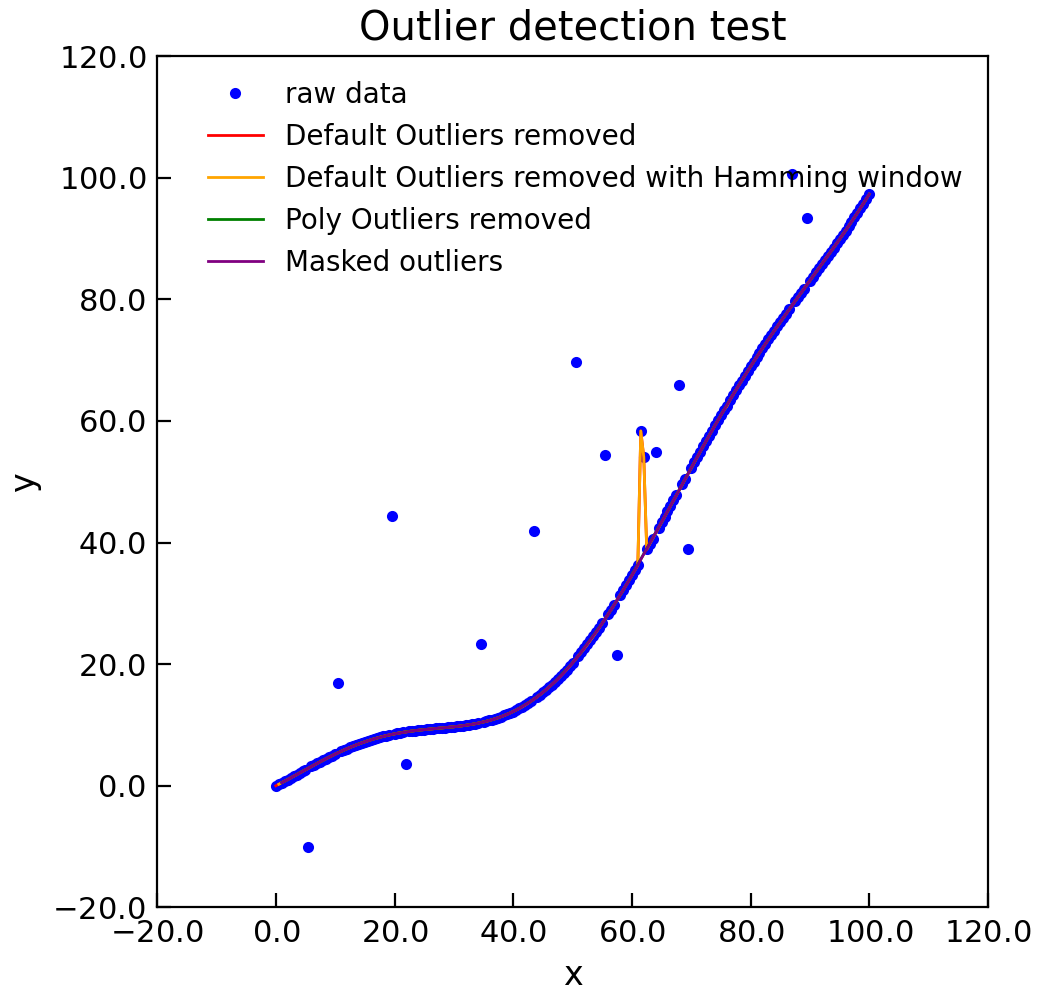
Example
"""Detect outlying points from a lione."""

import numpy as np

from Stoner import Data
from Stoner.analysis.utils import poly_outlier

np.random.seed(12345)
x = np.linspace(0, 100, 201)
y = 0.01 * x**2 + 5 * np.sin(x / 10.0)

i = np.random.randint(len(x) - 20, size=20) + 10
y[i] += np.random.normal(size=len(i), scale=20)

d = Data(np.column_stack((x, y)), column_headers=["x", "y"], setas="xy")
d.plot(fmt="b.", label="raw data")
e = d.clone
e.outlier_detection(window=5, action="delete")
e.plot(fmt="r-", label="Default Outliers removed")
h = d.clone
h.outlier_detection(window=5, action="delete", shape="hamming")
h.plot(color="orange", label="Default Outliers removed with Hamming window")
f = d.clone
f.outlier_detection(
    window=21, order=3, certainty=2, width=3, action="delete", func=poly_outlier
)
f.plot(fmt="g-", label="Poly Outliers removed")
g = d.clone
g = g.outlier_detection(
    window=21, order=3, certainty=3, width=3, action="delete", func=poly_outlier
)
g.plot(color="purple", label="Masked outliers")
g = d.clone
e.title = "Outlier detection test"

